Multiple Choice
Identify the
choice that best completes the statement or answers the question.
|
|
|
1.
|
The graph below relates speed and time of
four cars (1, 2, 3, and 4) traveling along a straight highway. 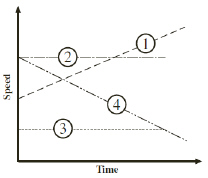 Which two
cars move with zero acceleration? (MCAS 2004)
a. | 1 and 4 | b. | 2 and 3 | c. | 1 and 2 | d. | 3 and
4 |
|
|
|
2.
|
The distance vs. time graph below shows data
collected as a remote-controlled car the moved across a level parking lot. (MCAS 2006)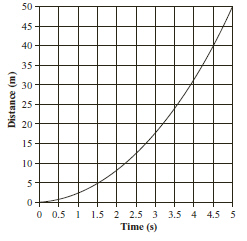 According to the graph,
which of the following conclusions about the car’s motion is supported? a. | The car is accelerating. | b. | The car is stopping and
starting. | c. | The car is traveling at a constant velocity. | d. | The car is moving
through an obstacle course. |
|
|
|
3.
|
The graph below relates velocity to time. (MCAS
2007)
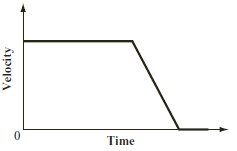 The graph would most likely apply
to which of the following events? a. | A soccer ball that is at rest is suddenly kicked. | b. | A ball is thrown
upward and returns to the ground. | c. | A person who is running at a constant speed
decides to run faster. | d. | A car traveling at a constant speed applies its
brakes and comes to a stop. |
|
|
|
4.
|
On the surface of the Moon, a ball is thrown straight up with an initial
velocity. The ball has a constant acceleration due to the Moon’s gravity. On a graph of the
ball’s velocity versus time, which of the following would represent the ball at its highest
point above the Moon’s surface? (MCAS 2008)
a. | when the velocity is equal to 0 m/s | b. | when the velocity is equal to 1.6
m/s | c. | when the velocity has its greatest value | d. | when the velocity
has its most negative value |
|
|
|
5.
|
A toy cart that has a weight of 10 N moves with a constant velocity of 2 m/s to
the right on a horizontal table. According to Newton’s laws of motion, which of the following
statements is correct? (MCAS 2009)
a. | The table exerts a force of 10 N upward on the toy cart. | b. | The toy cart exerts
a force of 10 N upward on the table. | c. | The toy cart exerts a force of 2 N downward on
the table. | d. | The table exerts a force of 2 N to the right on the toy
cart. |
|
|
|
6.
|
The graph below shows the speed of an object during a 10 s time
interval. 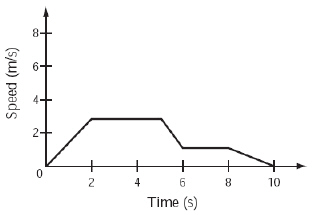 In which of the following time intervals
is the speed of the object decreasing? (MCAS 2010)a. | between 0 s and 2 s | c. | between 6 s and 8 s | b. | between 2 s and 4 s | d. | between 8 s and 10
s |
|
|
|
7.
|
The graph below shows the distance an object traveled over time. 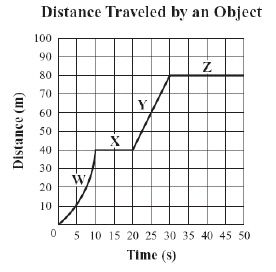 Which line segment represents the time interval during which the object was moving at
a positive constant speed? (MCAS 2011)a. | segment W | b. | segment X | c. | segment Y | d. | segment
Z |
|
|
|
8.
|
The graph below represents the motion of a car as it moves along a straight road
for 20 s. 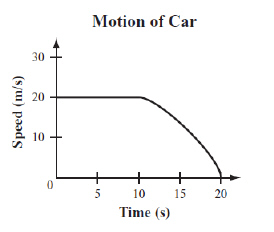 Which statement best describes the
motion of the car over the 20 s? (MCAS 2012)a. | The car is initially at rest and then backs up for 10 s. | b. | The car moves 20 m
in the first10 s and then stops. | c. | The car travels at a constant speed for 10 s
and then decelerates until it stops. | d. | The car travels at a constant speed of 20 m/s
and then decelerates until it is traveling at a constant speedof 15
m/s. |
|
|
|
9.
|
An object is traveling in a straight line. The graph below shows the
object’s velocity over time. 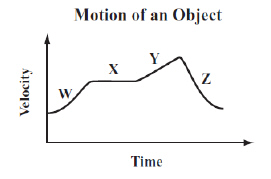 Which line segment shows the object
traveling with a constant, positive acceleration? (MCAS
2013)a. | segment W | b. | segment X | c. | segment Y | d. | segment
Z |
|
|
|
10.
|
The graph below represents the motion of an object over four time intervals, W,
X, Y, and Z. 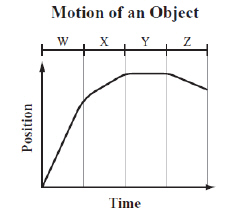 Over which time interval is the object
moving the fastest? (MCAS 2013)a. | interval W | b. | interval X | c. | interval Y | d. | interval
Z |
|
|
|
11.
|
The graph below represents the motion of a car. 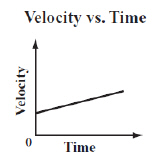 Based on the graph, which of the following statements describes the motion of the car?
(MCAS 2014)a. | The car initially travels at a constant speed and then stops. | b. | The car starts from
rest and then travels at a constant speed. | c. | The car starts from rest and then accelerates
at a constant rate. | d. | The car is initially moving and then
accelerates at a constant rate. |
|
Problems
|
|
|
12.
|
The graph below illustrates the position and time for a dog that runs to catch a
stick and then returns with it. 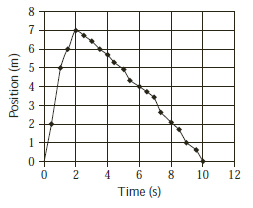 The dog caught the stick after 2 s. What
was the dog’s average speed as he returned with the stick? (Modified MCAS 2008)
|
|
|
13.
|
The graph below shows velocity measurements made
as a car moved north for 25 s. 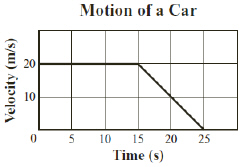 How far did the car move during the
first 15 s of the trip? (Modified MCAS 2009)
|
Open Response
|
|
|
14.
|
The chart below shows the position of a car
moving in a straight line. (MCAS 2004)
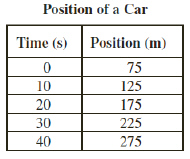
a. Use the data in the chart to
draw and correctly label a position versus time graph. b. Based on the data in the chart,
what is the average speed of the car in m/s from 0 s to 40 s? c. Based on the graph that you
have drawn, describe the acceleration of the car.
|
|
|
15.
|
The graphs below show movement over time. 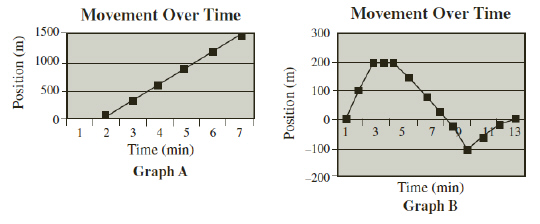 A truck
and car are on separate journeys on the same straight road. The truck is traveling at a constant
velocity. The car changes speed and direction. (MCAS
2005)a. Which of the graphs best represents the truck’s journey? Explain
your answer. b. Which of the graphs best represents the car’s journey? Explain
your answer.
|
|
|
16.
|
The figure below is a graph of net force vs. the acceleration of an object.
(MCAS 2006)
a. Use
the graph to determine the mass of the object. Show your calculations and include units in your
answer.
b. What acceleration will the object have if the net force
is 50 N and the trend shown by the graph continues? Show your calculations and include units in your
answer.
c. On the grid in your Student Answer Booklet, draw a
graph of force vs. acceleration if the mass of the object is halved and the object is subjected to
the same net forces. Label the axes on your graph and be sure to include units. Label this graph
“c.”
d. On the
same axes that you used in part (c), draw a graph of force vs. acceleration if the mass of the object
is doubled and the object is subjected to the same net forces. Label this graph
“d.”
|